Below are images showing precipitation in Virginia and other areas of the southeastern United States, and stream flow in Virginia, over the seven-day period ending October 4, 2016 (information available as of October 5). Also below is a national flooding overview map, as of October 5. The Virginia Water Resources Research Center thanks the agencies mentioned below for providing precipitation and stream-flow information and images. For the current month’s other weekly reports on stream flow and precipitation, please see the News Grouper posts available at this link: https://
For monthly reviews of precipitation, stream flow, and drought, please see the posts available at this link: http://
For more information on current and historical surface-water and groundwater conditions in Virginia, please see the U.S. Geological Survey (USGS) Virginia Science Center’s Web site,http://va.water.usgs.gov/.
 October 2016 Gaging Station of the Month: North Fork Shenandoah River at U.S. Route 55 near Strasburg (Shenandoah County), October 13, 2012. October 2016 Gaging Station of the Month: North Fork Shenandoah River at U.S. Route 55 near Strasburg (Shenandoah County), October 13, 2012.Precipitation
The following two color-coded maps show southeastern U.S. precipitation amounts (top map) and the percent of normal precipitation compared to normal for this period of the
year (bottom map) over the seven-day period ending October 4, 2016. The maps were accessed from the National Oceanic and Atmospheric Administration’s (NOAA) Southeast Regional Climate Center, located at the University of North Carolina in Chapel Hill; online at http://www.sercc.com/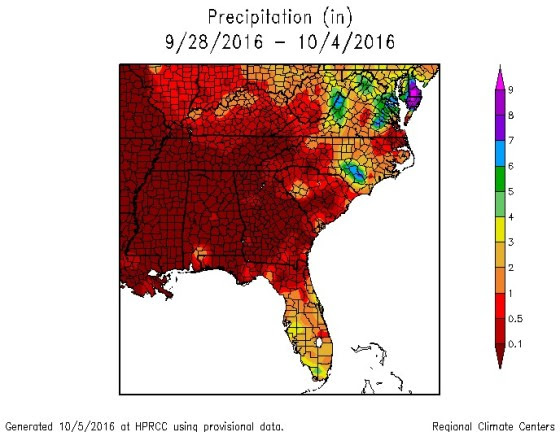 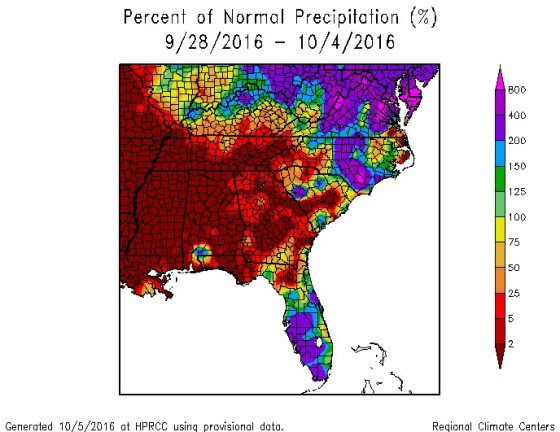
Another source of precipitation data is the National Weather Service’s Advanced Hydrologic Prediction Service,http://water.weather.gov/
Stream Flow
Seven-day-average Virginia stream flows at different gaging stations as of October 4, 2016, are indicated in the map below, from the U.S. Geological Survey WaterWatch for Virginia, accessed online at http://waterwatch.usgs.gov/
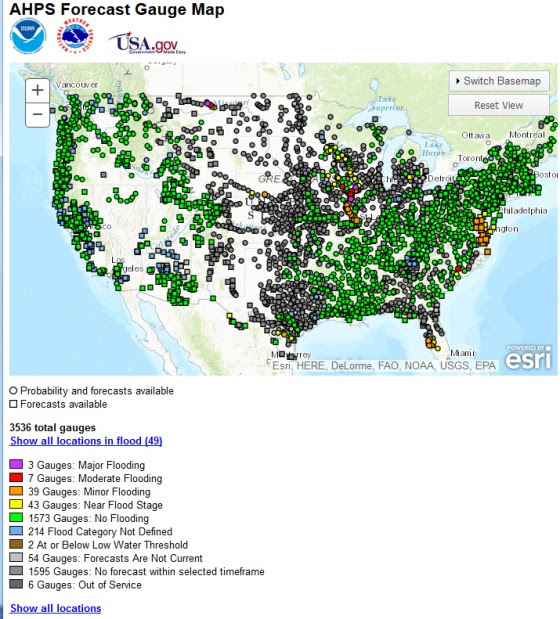
  Flooding Overview Nationwide
The National Weather Service’s Advanced Hydrologic Prediction Center’s map of river levels relative to flood stage (color-coded) is available online athttp://water.weather.gov/ahps/
 |

Wednesday, October 5, 2016
This week in Virginia precipitation:
From the ARAFLO Blog
Subscribe to:
Post Comments (Atom)
No comments:
Post a Comment